×

After eight years, Macro Polo has ceased operations as the Paulson Institute will focus its independent research on supporting its programs as it continues to diversify its scope.

We appreciate the community that has grown around Macro Polo and the fruitful engagement we’ve had with our legion of smart and sharp audience. You’ve pushed us to deliver even more original work and innovative products. Our body of work speaks for itself, and we hope it will have a long shelf life – that was the intent from MP’s inception.

MP’s website is now archived and no new work will be published henceforth on this site. Please visit www.paulsoninstitute.org for future research and policy work on a range of global issues.

Thank you all for the support over the years, it has been a privilege to have had a home at the Paulson Institute and to have built it the way we did.

- Team Macro Polo

Close

China hasn’t moved up Smile Curve as much as it has entrenched current position

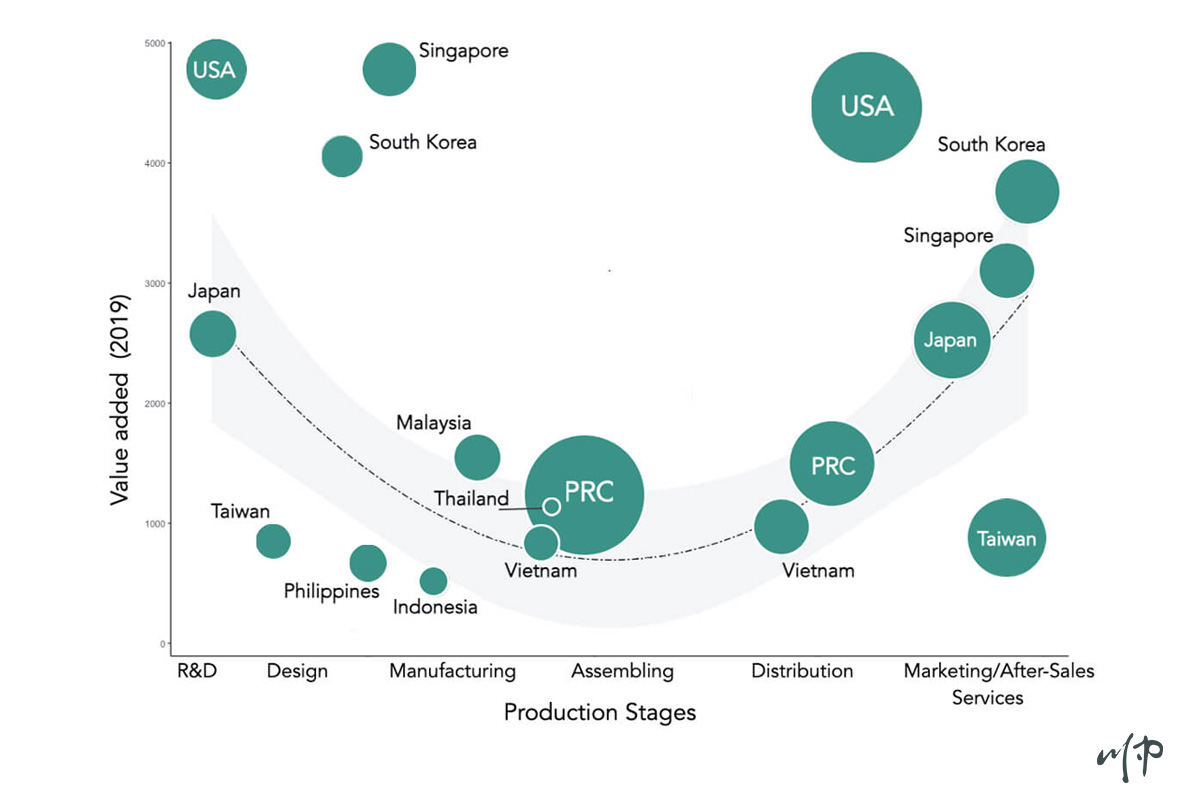
Note: The x-axis represents country/industry position in the production stage based on ADB MRIO data on Average Propagation Length. The y-axis represents labor productivity using ILO data on mean nominal monthly earnings by economic activity in PPP adjusted 2017 US dollar. The size of the circles represents total value added to the global value chain by country/industry.  

Source: ADB MRIO Database; UIBE GVC Index Team, “Data files structure of the UIBE GVC index system”; ILO; national statistics bureaus; MacroPolo. 


Next Charts:


Stay Updated with MacroPolo

SHARE THIS chart